
Somebody in the company asked for a dashboard. A few weeks later there is one: a page full of charts, coloured tiles and filters, connected to the booking system, the accounts and the time sheets. It looked impressive in the meeting where it was shown. Three months on, the person who asked for it opens it once a fortnight, everyone else has forgotten the link, and the real figures still travel round in a spreadsheet that someone updates by hand every Monday.
That is not a failure of the tool, and usually not a failure of the data either. The numbers on the screen are often correct. The page simply does not answer a question anybody has at nine in the morning, so nobody has a reason to open it.
This article is about the mistake behind that, why it is so easy to make, and what a dashboard looks like when the team opens it every day without being reminded: who it is for, which few numbers belong on it, where it should live, and how to tell, after a month, whether it is working.
The mistake: showing everything you have
The mistake I see most often is building a dashboard around the data that is available instead of around a decision somebody makes.
It goes like this. The systems already hold a lot of information: appointments, invoices, hours, enquiries, cancellations, response times. Someone connects a reporting tool to all of it, and the obvious next step is to show what is there. Every table becomes a chart. Every chart gets a filter. The result is accurate and complete, and it answers no particular question, because it was never asked one.
A dashboard built that way is a catalogue. People open a catalogue when they are looking for something specific, which is rarely. A dashboard the team opens every morning is closer to a checklist for the day: it tells one group of people what needs their attention now.
Why it is so easy to fall into
It is worth understanding why this happens, because the people involved are usually doing their jobs well.
The person who asks for a dashboard often cannot say exactly what they want. "I want to see how we are doing" is a fair request and a very hard specification. The person building it fills the gap with what they can see: the fields in the database. Adding one more chart is easy and feels like more value. Leaving a chart out feels like holding something back.
Reporting tools encourage it too. Connecting a data source and dragging fields onto a page takes minutes. Deciding which three numbers matter to the person who runs the front desk takes a conversation, and that conversation is the part that gets skipped.
Start from one decision, not from the data
Start the other way round. Before anyone opens a reporting tool, write down one decision someone makes regularly, in plain words.
For a physiotherapy clinic it might be: "Each morning the practice manager decides whether to offer today's free slots to the waiting list, and which therapist should take the urgent calls." For a company that services boilers: "Each morning the coordinator decides which jobs are at risk of missing the agreed visit window and who can be moved to cover them." For a language school: "Every Monday the director decides which groups are too small to run next month and need a push or a merge."
Each of those sentences names a person, a moment and a choice. Once you have that sentence, most of the dashboard designs itself: it needs the numbers that change the choice, and nothing that does not. A chart that would not change the decision, however interesting, belongs somewhere else.
One reader, one moment
A dashboard for "everyone" is a dashboard for nobody. The practice manager, the therapists and the owner need different things at different times, and one page that tries to serve all three serves none of them well.
Pick one person or one role for the first version. Ask when they would open it: at the start of the day, before the weekly meeting, at the end of the month. The answer changes what belongs on the page. A morning page is about today and the next few days. A weekly page compares this week with the last few. A monthly page is about trends and money.
If two roles genuinely need something, give them two small pages rather than one large one. Two pages that each get opened beat one that gets admired.
A few numbers on the first screen
The first screen should show a handful of numbers, somewhere between three and seven, that someone can take in within a few seconds. Everything else can sit one click away.
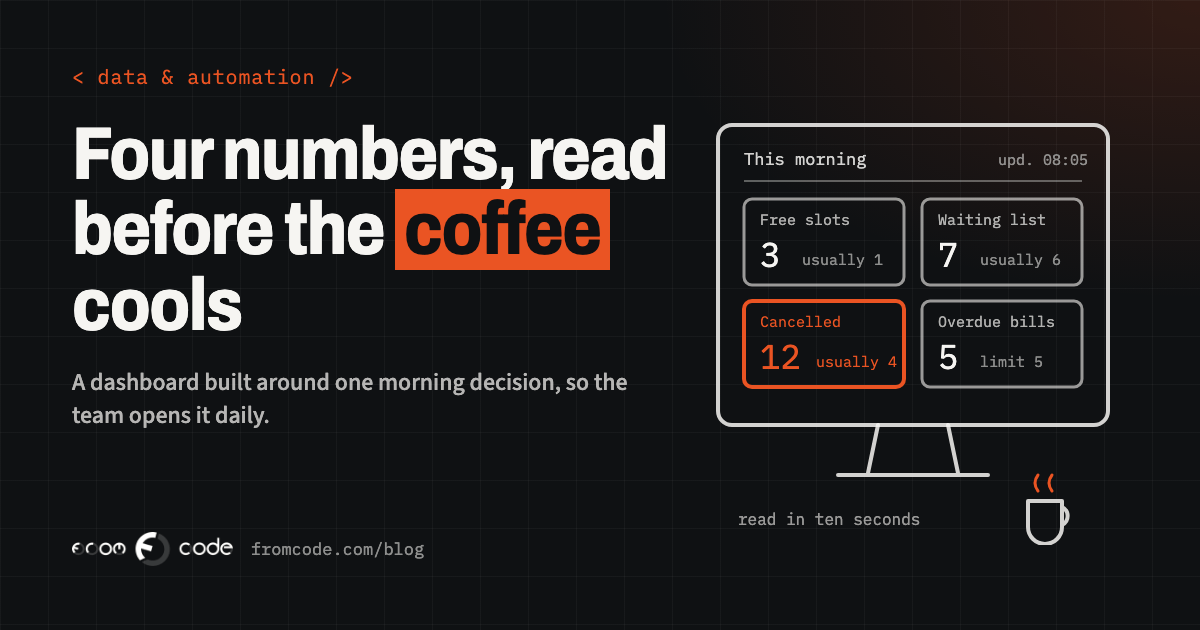
For the clinic, the first screen might be: free slots today and tomorrow, people waiting for an appointment, cancellations since yesterday, and unpaid invoices older than thirty days. Four numbers. The practice manager can read them while the coffee is still hot and know what to do first.
Detail still matters, but it lives behind the number. Click "people waiting" and you see the list, with names, how long each person has waited and what they asked for. The headline tells you whether to act; the list tells you how.
Every number needs a "compared with what"
A number on its own means very little. "Twelve cancellations" is alarming for a small clinic and normal for a large one. Every number on a daily dashboard needs something next to it that says whether it is good or bad.
Usually that is one of three things: the same figure last week or last month, a target someone agreed, or a limit beyond which someone has to act. "Twelve cancellations, usually four" says more than any chart. "Seven invoices overdue, limit five" tells the reader exactly what to do next.
Colour helps, but sparingly. If half the tiles are red every morning, red stops meaning anything. Keep strong colour for the one or two things that actually need attention today.
Make each number lead to an action
A good test for a tile is to ask what the reader would do if the number changed. If the answer is "nothing, but it's nice to know", the tile is decoration.
The most useful dashboards end in a list of names, not a chart. "Three boiler services today are at risk of missing their window: here they are, here is the engineer on each, here is who is free nearby." The coordinator can pick up the phone straight away. A chart of "visits per week by region" is pleasant to look at and leads to no particular call.
Where the system allows it, let people act from the same screen: mark an invoice as chased, move a job, send the waiting-list message. Every step between seeing a problem and fixing it is a place where people give up.
Numbers people can trust
People stop trusting a dashboard the first time it disagrees with what they know. The practice manager knows the morning was fully booked; if the screen says there are free slots, they stop believing the screen, and they rarely start again.
Two things prevent that. First, every number has one agreed definition and one source. "Active client" means one thing, written down, calculated in one place, not three slightly different versions in three tools. Second, the page says how fresh the data is: "updated 08:05" in the corner. A number from last night is fine for a monthly view and useless for deciding who takes this morning's urgent calls.
If the figures come from systems that do not talk to each other, that is the problem to solve first. A dashboard on top of retyped data only shows the retyping errors more clearly. Making two systems talk to each other covers what that involves.
A test for every tile
Before a number goes onto the first screen, answer three questions about it. Who looks at it? What do they decide differently when it moves? What do they compare it with? If any answer is missing, the number goes on a second page, or nowhere. This one test removes more clutter than any amount of design work.
Put it where people already look
A dashboard that has to be remembered, found and logged into competes with everything else in the morning. Put it where people already look.
That might be a screen on the wall of the coordinators' office, a short e-mail that lands at eight o'clock with the four numbers and a link, or a tab pinned in the chat tool the team already uses. Most reporting tools can do some of this. Google's free reporting tool, which went back to the name Data Studio in April 2026 after a few years as Looker Studio, can e-mail a report on a schedule; its release notes list daily limits on how many recipients the free version sends to, and several of the e-mail options are kept for the paid Pro version.
Check what sharing costs before you choose. Microsoft's Power BI has a free account for building reports, but its pricing page says that sharing them needs a paid licence, listed at $14 per user per month for Pro when I checked in November 2026. For a team of ten that is a running cost worth knowing about at the start, not after the dashboard is built.
A reporting tool or a page in your own system
An off-the-shelf reporting tool is often the right first step. It is quick to try, it connects to common systems, and it lets you find out which numbers matter before spending much on them. If the data sits in a few well-known services and nobody needs to act from the screen, it may be all you ever need.
A dashboard built into your own business system makes more sense when the numbers need rules only your business has (what counts as "at risk" for a job, which client is "active"), when people should be able to act from the same screen, or when the data is sensitive enough that you would rather it never left your own system. In that case the dashboard is simply the first screen of the system, the page staff land on when they log in, and it is maintained with the rest of it.
Either way, the decision you wrote down at the start is the specification. It is much easier to price, build and check than "show us how we are doing".
Check, after a month, whether it is opened
A month after launch, find out whether the page is used. Most tools can show how often a report was opened and by whom; a page in your own system can record it in a line of code. If the person it was built for has not opened it most mornings, ask them why. The answer is usually specific: a number they do not trust, a number they need that is missing, or the page living somewhere they never go.
Then change it. Remove the tiles nobody looked at. Add the one number people keep asking for. A dashboard is never finished on launch day; the first month of real use is where the design actually happens.
And when a page is not used at all, retire it. An abandoned dashboard is worse than none, because the next time someone asks "do we have a report for that?", the answer is "yes, but nobody trusts it".
What I would do first
If I were starting a dashboard for a business tomorrow, I would take these steps, one after another. Write the decision sentence with the person who makes it. Agree on four or five numbers and what each one is compared with. Write down where each number comes from and how fresh it needs to be. Build the smallest version in whatever tool is quickest, put it where that person already looks, and watch for a month. Only then decide whether it deserves to become a proper part of the business system.
None of that needs a large budget. It needs one honest conversation about what someone actually decides each morning, and the discipline to leave everything else off the first screen. The dashboards that get opened every day are rarely the most impressive ones. They are the ones that make the first ten minutes of the morning easier.
If the numbers you need are spread across spreadsheets and systems that do not talk to each other, the internal tool that replaces the spreadsheet everyone is afraid to touch is a good next read.
Which decision would your team's dashboard make easier?
Discuss your projectTell me who would open it and what they decide, and I will tell you what it would take to build.